
Astronomy's Big Problem And How Henrietta Leavitt Solved It
Looking up at the night sky, what do we see? Specs of flickering light and fortunately not the type that causes a medical scare. What our eyes see from Earth are various star types, and being an amateur astronomer like me, we wonder how big they are compared to the Sun, how old they might be, and how far they are.
Some celestial objects do come very close, like your revolving comet with a captivating tail or a rogue meteorite. In fact, a spectacular show begins in September and ends in November when Earth makes its annual pass through an asteroid amassment called the Taurid Meteor Stream. Some of its smaller rocky bodies get pulled in by the Earth's gravity, and when the atmosphere burns them while making their way to bedrock, a natural light show is visible to the naked eye.
Beyond these close encounters, the most magnificent of these "light shows" are much further away, as seen in the images taken by our most powerful space and ground telescopes like Hubble, Euclid, and FAST. These telescopes all have instruments installed to send data about distance. Long before these autonomous instruments, distances were calculated by hand. Before the Apollo missions, we knew reaching the moon took approximately three days. Before the Sojourner rover, we understood it would take about 15 months to reach Martian soil. And with the launch of the Europa Clipper, we know that it'll reach Jupiter's icy moon by 2030. Distance is measured even outside the solar system. For example, we know it'll take 3.2 lightyears to reach the nearest star to the Sun – Alpha Centauri.
So, how did we come to understand distances relative to us? It's a mosaic of a story that involves many notable people and their timeless concepts. Two American astronomers from a small school named Harvard University made measuring incomprehensible distances comprehensible, albeit in most cases impossible to reach the destinations. But the importance of interpreting distances wasn't necessarily about traveling them but understanding that the universe is illogically big and continuously expanding.
The first astronomer, Edward Charles Pickering, gave the second - Henrietta Swan Leavitt, a platform. She ultimately built astronomy on her creative shoulders. We'll delve into their stories, seeking a detailed but digestible understanding of early measurement and star classification and what these topics mean for us today. So first, let's start with the Greeks, the first population to classify certain stars, which began a long, long time ago.
The desire to measure the distances of stars goes back far, further back than the belief of the Sun orbiting Earth. Still, measuring absolute distance wasn't the first thing early astronomers did, and classifying the luminosity of stars began in ancient Greece. During the second century BCE, a Greek astronomer named Hipparchus looked up into the sky and decided to catalogue some visible stars based on their brightness. Using the numbers 1-6, Hipparchus categorized the brightness of 850 stars. His number line had an inverse relationship with them, meaning a star given a smaller number from 0 is brighter than the one given a larger number.
Fast forward 280 years, we have Ptolemy, not one of the deranged Greco-Egyptian kings, but an influential Roman mathematician who built upon Hipparchus' work to include a few hundred more stars in this first astronomical catalog. Then came the famous Italian observer Galileo Galilei – after turning his telescope to the sky in the early 17th century, objects within and outside the solar system that were previously impossible to see with our eyes were being observed for the first time. Believing in the necessity, he added the following number to the magnitude scale, 7, beginning the exponentially positive numbers on the line.
Diving a little deeper into the inverse relationship of magnitude, the higher the number on the scale of a cataloged star, the dimmer that star is relative to the observer on Earth.
Vega in the constellation Lyra is a 0, making it much brighter than Polaris' magnitude of 2. And while they weren't cataloged until much later, the brightest celestial objects have negative magnitudes. Sirius is -1.46, and a full moon is -12.7, while the Sun clocks in at -27, and we're all familiar with the dangers of staring at its brilliance for too long.
In terms of the brightest celestial object, the Sun's magnitude is really the limit for us because it's the brightest thing we can see. The magnitude scale, as we know it today, was standardized by Norman Robert Pogson in the 19th century. His logarithmic system established that a difference of 5 magnitudes corresponds to a 100-fold difference in brightness.
For example, a star with a magnitude of 1 is 100 times brighter than a star at magnitude 6. On the positive side, the scale expands exponentially with stars like Vega and beyond as the universe stretches out with no real end in sight.
Vega is also what might have influenced some of the first ideas into taking this magnitude scale further.
Edward C. Pickering and a New Star Map
Edward Charles Pickering was born on July 19, 1846, in Boston. He developed a lifelong fascination with the ambiguity of things beyond Earth's reach. Just four years after his birth, the world was mesmerized by the release of the first-ever image of a star other than the Sun. This breakthrough fascinated those around him, likely inspiring his interest in astronomy. The star, Vega, was captured on July 17, 1850, by William Bond, the first director of the Harvard Observatory, and photographer John Adams Whipple using a 15-inch equatorial telescope. Little did little Edward know that 27 years later, he would be leading the same observatory.
After finishing Latin School in Boston, he pursued astronomy by attending the Lawrence Scientific School at Harvard University. He graduated at 19 and was nearly immediately hired as an instructor there before moving to the Massachusetts Institute of Technology (MIT) to become an assistant professor of physics a year later. At just 23, Edward became a full professor of physics at MIT, establishing a norm where students used measuring tools to determine the distances to various stars. Eight years later, he was appointed as the head of astronomy and director of the Harvard College Observatory.
During his first year as director in 1877, Edward recognized that one field had not been thoroughly explored by other observatories: photometry—an evolution of the concept of magnitude. Photometry provided precise measurements of a star's brightness, offering valuable preliminary information about an object's temperature, age, and absolute location but not distance.
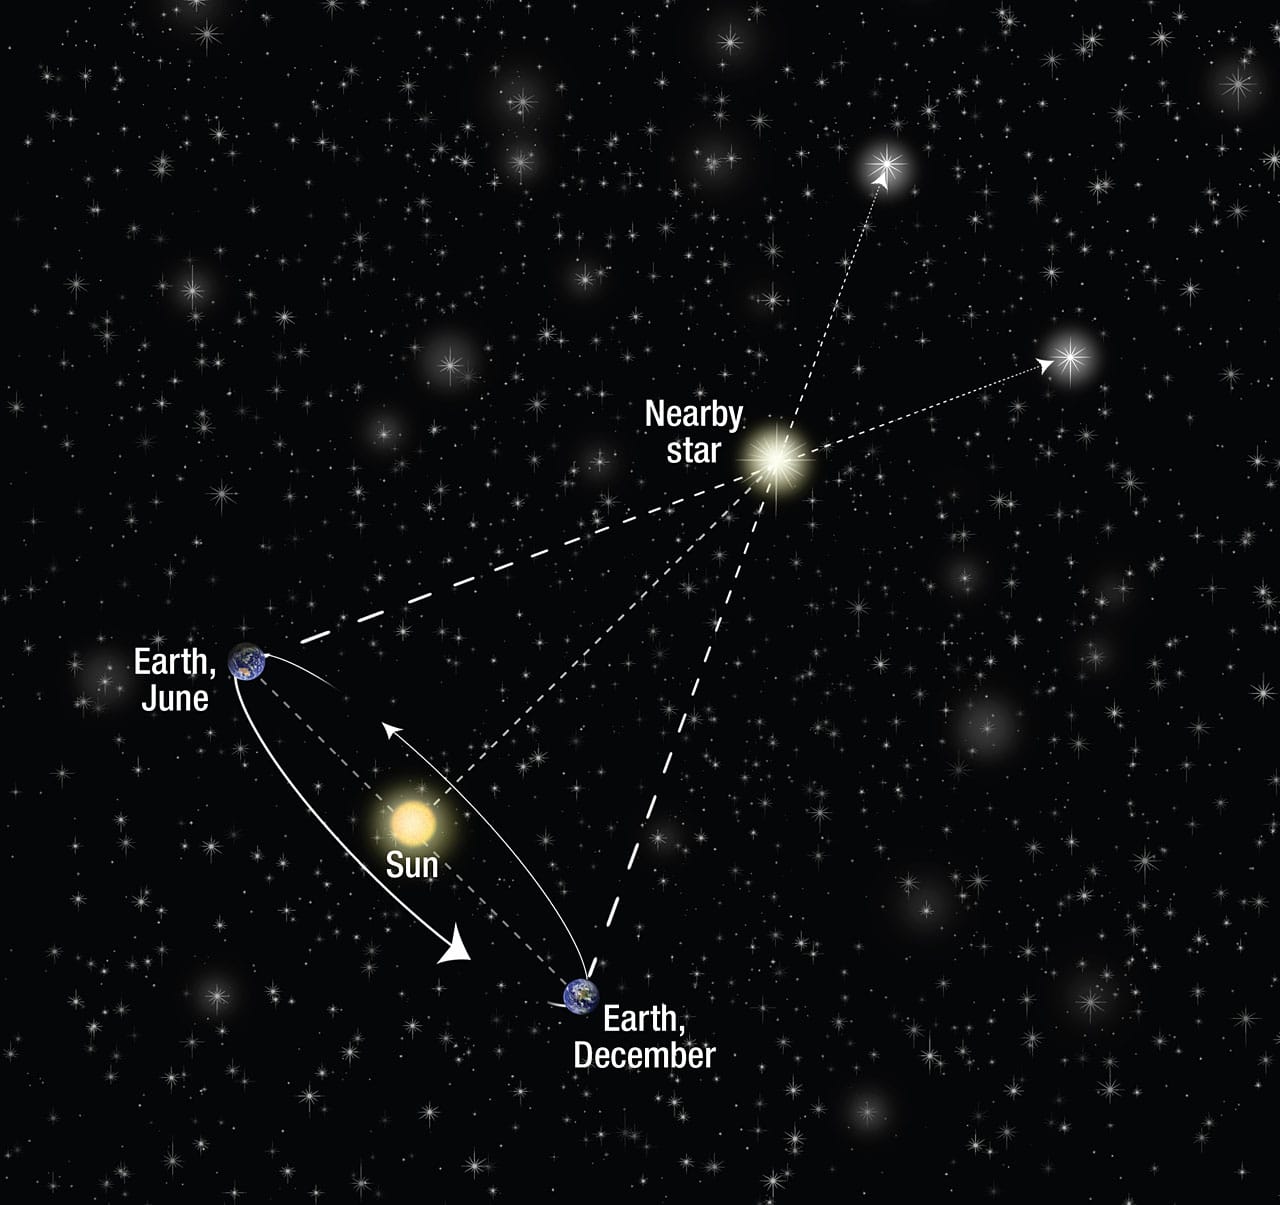
Distance, was measured using the parallax method up until the early 20th century. Imagine walking along a trail with trees and mountains in the distance. As you move, nearby trees seem to pass by quickly, while distant mountains barely appear to move. This effect, where closer objects shift more noticeably than distant ones as you change position, is called parallax.
Astronomers use parallax to measure the distance to nearby stars by observing how their positions appear to shift when viewed from opposite sides of Earth's orbit, six months apart. By calculating this angle of shift and using the known distance from Earth to the Sun—about 93 million miles—astronomers can estimate the distance to a star. This technique works best for stars relatively close to us, as those farther away show only very tiny shifts.
And that's its limitation, because it only works for angles we can clearly measure. When the angle becomes too small our atmosphere interefers with that measurement. So, scientists couldn't accurately measure anything beyond 100 lightyears and well, the Milky Way galaxy alone is about 100,000 lightyears wide. Still, the parrallax technique was the most reliable one to use in astronomy until 1908.
One of the star catalogs that Edward closely examined was the Bonner Durchmusterung (BD for short), which documented preliminary details of over 324,000 stars between 1859 and 1863, covering stars visible from only Earth's northern sky down to just below the equator. Led by German astronomer Friedrich Argelander, this catalog helped scientists worldwide gain a better understanding of certain star locations and magnitude for further study.
Both seasoned and amateur observers still use this sky map today because stars can be easily identified based on their sky positions. For example, BD-16 1591 refers to Sirius, the 1591st star in a specific zone between -16 and -17 degrees in declination. Alpha Centauri is listed as BD-60 3563 because it's located between -60 and -61 degrees. This system holds valuable information for anyone with a budget equatorial telescope even though the catalog is nonsystematic.
Determined to push the boundaries of astronomical observation, the young director Pickering collaborated with the optic makers, Alvan Clark & Sons to create new photometric instruments. The first was a 1.5-inch aperture photometer, which helped catalog the magnitudes of over 4,000 stars, leading to the creation of the Harvard Photometry catalog. Building on this success, Pickering introduced a 4-inch meridian photometer, which enabled observations down to a magnitude of 9.5, eventually adding 60,000 stars over a 20-year period. By 1906, the catalog had expanded to include magnitude measurements for over 1.5 million stars. Although it's said that Pickering took many measurements himself, the immense scale of this project points to him heavily relying on his team.
We'll talk more about his team's contribution, but first, what exactly is photometry? Astronomers measure the brightness of stars and other objects using a photometer, a special device that counts light particles, or photons, within specific color ranges. Filters help focus on these certain colors by blocking out others, making it easier to see brightness that may be invisible to the human eye. The measurements are later calibrated by comparing them with well-known, bright stars that have precisely measured brightness.
In 1884, Edward officially established the Harvard Photometry, the first major catalog to systematically record the magnitudes of stars. Achieved by his standout contribution to the field - the meridian photometer in 1879, an instrument essential to the Harvard Photometry catalog.
The meridian is a line of longitude running from the North Pole to the South Pole, connecting points with the same east-west position. The photometer, specifically designed to measure starlight intensity by comparison, was aligned along the meridian to reduce any atmospheric interference.
This setup allowed Edward and his team to compare each star's brightness to that of a known reference star. They used an adjustable lens to match the stars' brightness, allowing them to record their relative magnitudes systematically.. This precise method of balancing and comparing light intensities enabled the creation of the Harvard Photometry, the first significant star catalog that documented star magnitudes across both the Northern and Southern hemispheres.
In addition to the meridian photometer, the observatory employed large-aperture telescopes to capture detailed images on photographic plates. Much like the human eye, where the pupil expands or contracts to control light intake, a telescope's aperture adjusts to gather more light, crucial for capturing dim objects like faint stars. Larger apertures allow for the collection of more starlight, making it possible to observe fainter stars at greater distances.
In smartphones for example, the aperture size is typically expressed as an f-stop (e.g., f/1.8). Lower f-stop numbers allow more light in, making them better for low-light photography. However, smartphone apertures are much smaller than those in telescopes, which rely on large apertures to observe significantly more light. For instance, a 1.6-inch aperture telescope can detect very faint stars (up to magnitude 9.5), while a smartphone camera, with a smaller aperture, can only capture the brightest stars (around magnitude 3 or 4), revealing just a few thousand stars under favorable weather conditions.
The photographic plates were essentially images taken with a specialized telescope, recorded on glass to avoid the wear and tear that paper would suffer over time. These plates expanded the catalog through careful measurement. Contrary to what many might assume, this meticulous work was actually done by a group of women known as 'computers.'
I'll be honest, I don't think Charles Pickering was particularly kind, but he did pave the way for the renowned astronomer Henrietta Swan Leavitt, one of the dozen or so 'computers' who worked under his authority, ultimately expanding the recognition of women in astronomy.
How A Computer Changed The Rules
These women were referred to as "computers" or "Pickering's harem" because their work required extensive calculations to process data from photographic plates. To create an accurate star catalog, one had to know precisely where each star was located and this meant taking meticulous measurements from the plates, converting those measurements into inches or millimeters, and then transforming them into sky coordinates.
Women, as Pickering himself believed, were particularly suited to this kind of painstaking work due to their patience and keen eyesight. Maria Mitchell, one of the earliest female astronomers, famously said, "Just as we do fine embroidery with care, we apply the same attention to detail in studying the stars." It's a brilliant analogy that underlines the precision required in this work.
Earlier, I mentioned that Edward C. Pickering wasn't, in my opinion, known for his kindness, and this partly stemmed from how poorly these "computers" were compensated. Initially, they weren't paid at all, driven instead by a love for astronomy and the limited opportunities available for women in science. Societal norms deemed it improper for women to operate telescopes overnight, even though telescopes were pretty much ineffective during daylight hours.
So, although Pickering and the Harvard Observatory amongst many others struggled with funding, he received significant donations — thousands of dollars, the equivalent of millions today. Still, despite the emphasis on cataloging the cosmos, these dedicated women earned only 25-30 cents an hour, about $10.50 a week.
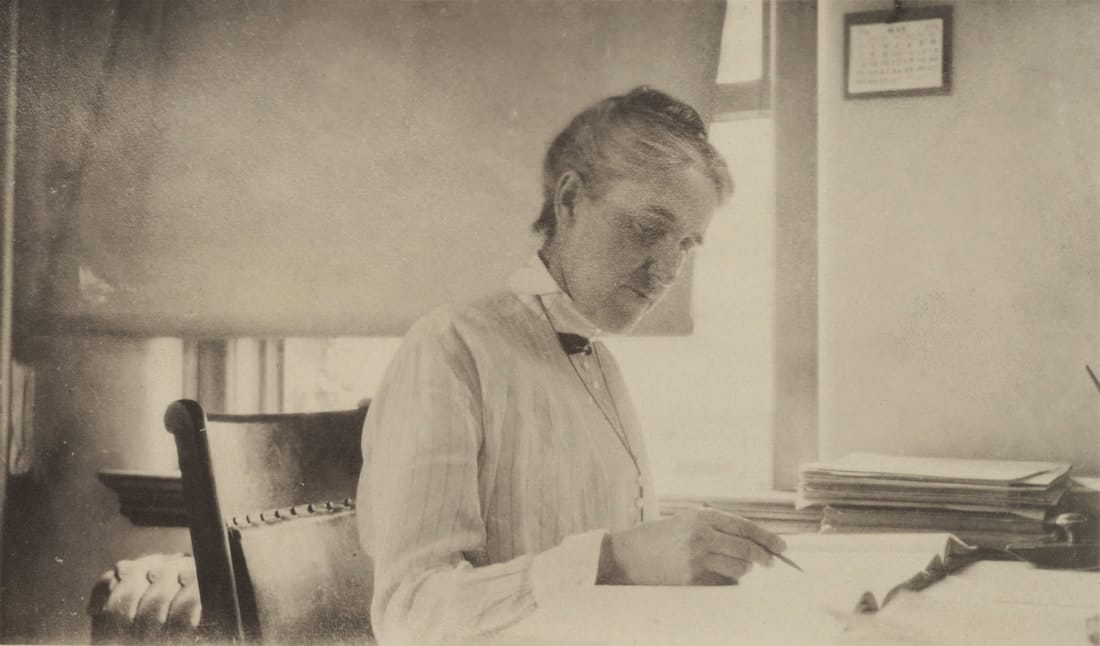
One of these highly educated computers was Henrietta Swan Leavvit. There is virtually nothing known about Leavitt - who she really was, what she thought, etc. There is no trove of letters, no diary or journal she left behind, and very few photos. But there is some information that is known about her.
She was born in Massachusetts in 1868, entered Radcliffe College (then the Society for the Collegiate Instruction of Women) at 20. Her rigorous education covered everything from classical Greek and fine arts to analytical geometry and calculus—more than enough to build a successful academic career if she had been a man. So, when Leavitt took up employment at Harvard College Observatory by going to the director in 1893, the conversation more or less played out like this: 'Dr. Pickering, I want to be an astronomer' to which he replied "I'm sorry Miss Swan but astronomy is for men only, only men can operate telescopes' however, he continued "we could use you as a 'computer' analyzing the plates taken by the men'.
And that's exactly what she did for the next couple of decades. But she was a lot more attracted to a specific type of pulsating star on these plates. They're called cepheid variable stars a type of star that goes through periods of relative brightness and dimness, of which she personally discovered many new examples – earning her the offhand praise of one Princeton astronomer who described her in a letter to Edward Pickering as 'a variable star fiend'. Even the Washington Post facetiously likened her to Charles Frohman, a theatrical producer of the time famous for having launched many 'stars'.
A Cepheid star is an extremely luminous supergiant that undergoes periodic changes in their luminosity, so intense in luminousity infact, that we can see them in different galaxies.
These are what gives us the very precise approximation of distances in space.
Now, Cepheid variables were known to astronomers by the late 18th century. But Henrietta Leavitt made them as valuable as they are today. She was able to observe the relationship between their periods and maximum luminosity of these stars. From this relationship, scientists were able to find the exact distance of any variable star she observed.
Before we explore that relationship that she uncovered, lets talk about the big problem with an equation used for measuring star distances based on magnitude alone, dubbed the luminosity equation.
The equation helps astronomers figure out how far a star is by comparing its true brightness with how bright it appears from Earth. Without getting into the math, the idea is that as a star gets farther away, it looks dimmer to us. Specifically, if a star is twice as far away, it appears four times dimmer. This makes it seem like we could easily tell distance by brightness alone.
The problem is that stars can have very different true brightness levels. A bright star (Star A) far away could appear just as bright as a dimmer star (Star B) that's closer. So, without knowing a star's actual luminosity—which we can only determine if we know its distance from methods like parallax with its limited range—we can't tell if the star is far away and very bright, or closer and less bright.
Henrietta observed over 2,500 variable stars and knew that every variable star had a period of about 5 days between the star's luminosity got larger and smaller before repeating the cycle. So she wanted to know if there was a relationship between the period of the star and the maximum luminosity it reached. She ran into the same problem we just spoke about regarding the brightness equation.
Because there wasn't a way for her to differ between further cepheid stars, beyond 100 light years, or the few that were closer.
There were some plates however with blobs or clusters that showed evidence of many of these cepheid stars. She reasoned that since it's a cluster of stars, they were about the same distance from Earth.
So now, if the stars she observed were all roughly the same distance as others in that cluster to Earth, it meant that if Star A outshun Star B's brightness, then Star A must actually have higher luminosity. So while she didn't know the actual luminosity of these distant stars, she could compare them relative to each other.
Henrietta Leavitt’s published a paper in 1912 that introduced the Period-Luminosity Relation, showing a clear linear relationship between the period of a Cepheid variable star’s brightness changes and its relative luminosity. On her graph, the x-axis represented the period in days (logarithmic scale), and the y-axis showed relative brightness. This let her predict, for example, that a star with a 10-day period would be around 10 times as bright as one with a 1-day period. She realized that if she could determine the absolute luminosity of one Cepheid star, she could convert the entire graph to show absolute luminosities, enabling astronomers to calculate distances to Cepheids based solely on their period.
Once astronomers determined the absolute luminosity of a few nearby Cepheids (within 100 light years) using parallax, they were able to use Leavitt's graph to measure distances far beyond what parallax alone could reach. By matching the period of a distant Cepheid to Leavitt's graph, they could find its luminosity, and then apply the brightness-distance formula to calculate its distance. For example, if a star had a period of 100 days and appeared with a certain brightness from Earth, astronomers could finally estimate its true distance using the inverse-square law, allowing them to observe stars millions of light years away.
Her breakthrough turned cepheid variables into another name called standard candles because of their predictable luminosity-period relationship. As standard candles, Cepheids have known luminosities that can be used to calculate their distance based on how bright they appear from Earth. Leavitt's discovery allowed astronomers to map the Milky Way and measure distances even to other galaxies. Because the 'star clusters' that she got the idea from were infact the magelanic clouds. The dwarf galaxies that orbit the milky way. She revolutionized our understanding scale of the universe.
The last glass plate was submitted at the Harvard Observatory in 1989, bringing the total to about 550,000 plates since 1885, each recording approximately 100,000 stars.
Unfortunately, Ms.Leavvitt never got the flowers that she deserved. Several individuals in Leavitt's professional circle benefitted from her groundbreaking discovery, with Edward Pickering among the foremost. As director of the Harvard College Observatory, Pickering published her findings under his own name, presenting her work in a 1912 Harvard Circular but crediting Leavitt merely as the "preparer" of the data. When Harlow Shapley succeeded Pickering as director, he leveraged Leavitt's period-luminosity relationship to expand our understanding of the Milky Way's structure. Though his achievements relied heavily on Leavitt's research, she received only minimal acknowledgment.
Her discoveries, especially the period-luminosity relationship, later paved the way for the discoveries of other astronomers, particularly Edwin Hubble. In 1925, Magnus Gustaf (Gösta) Mittag-Leffler of the Swedish Academy of Sciences proposed to nominate her for the Nobel Prize in Physics, not knowing that she had died from cancer four years before.