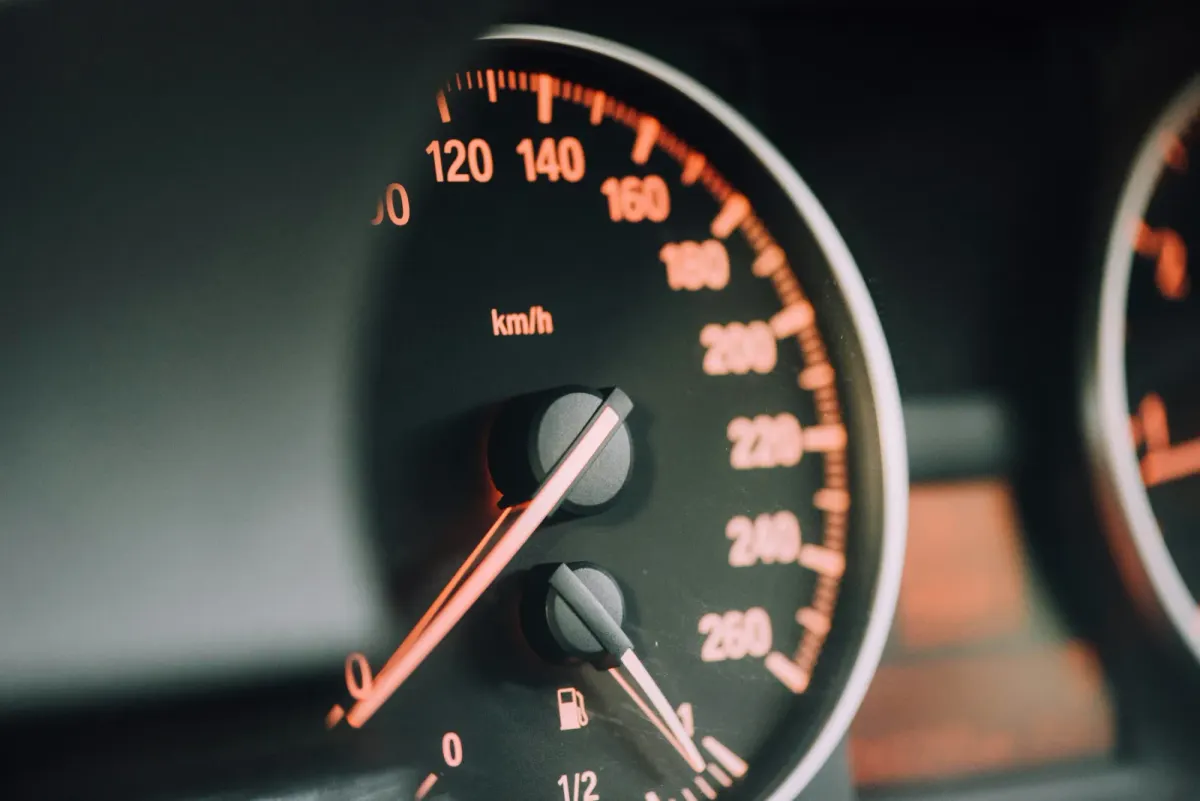
When you’re trying to save a few minutes on a journey, the speedometer gives you a number in kilometers per hour and leaves you to work out how much sooner you’ll arrive.
Researchers used a driving simulator to find out whether a speedometer showing minutes per kilometer would help drivers judge how much time they were saving. The drivers were told to save exactly three minutes on a repeat of a journey they had just completed. After fifteen minutes of practice with the steering wheel and pedals, they drove a rural road displayed on three screens and repeated the trip at a speed they chose. No traffic ahead slowed them down, though some vehicles passed in the opposite direction, so they could pick a speed and keep going. Each driver did this after a journey at 30 kilometers an hour and another at 100 kilometers an hour.
Gabriella Eriksson, Ola Svenson, and Lars Eriksson picked different route lengths so that both starting speeds would result in a journey of about seventeen minutes. The researchers could figure out the durations from those lengths, but they did not give the drivers either the distance or the time of their first trip. The drivers only had their memory of the first trip and the information on a dial. This information differed between two groups of twelve participants, who were recruited together and randomly assigned to the groups. One participant drove as fast as possible both times, so the researchers replaced him, thinking he misunderstood the instructions. One group got a regular speedometer, while the other saw a display showing minutes per kilometer.
For the twelve drivers using the regular speedometer, repeating the slow journey saved just over six minutes on average. Afterward, their estimates of the saving averaged about three and a half minutes. Their average guess for speed was about 46 kilometers an hour compared to a recorded average of 45.5. When averaged across the group, their estimates of how fast the car went were close, but their estimates of the time saved were not.
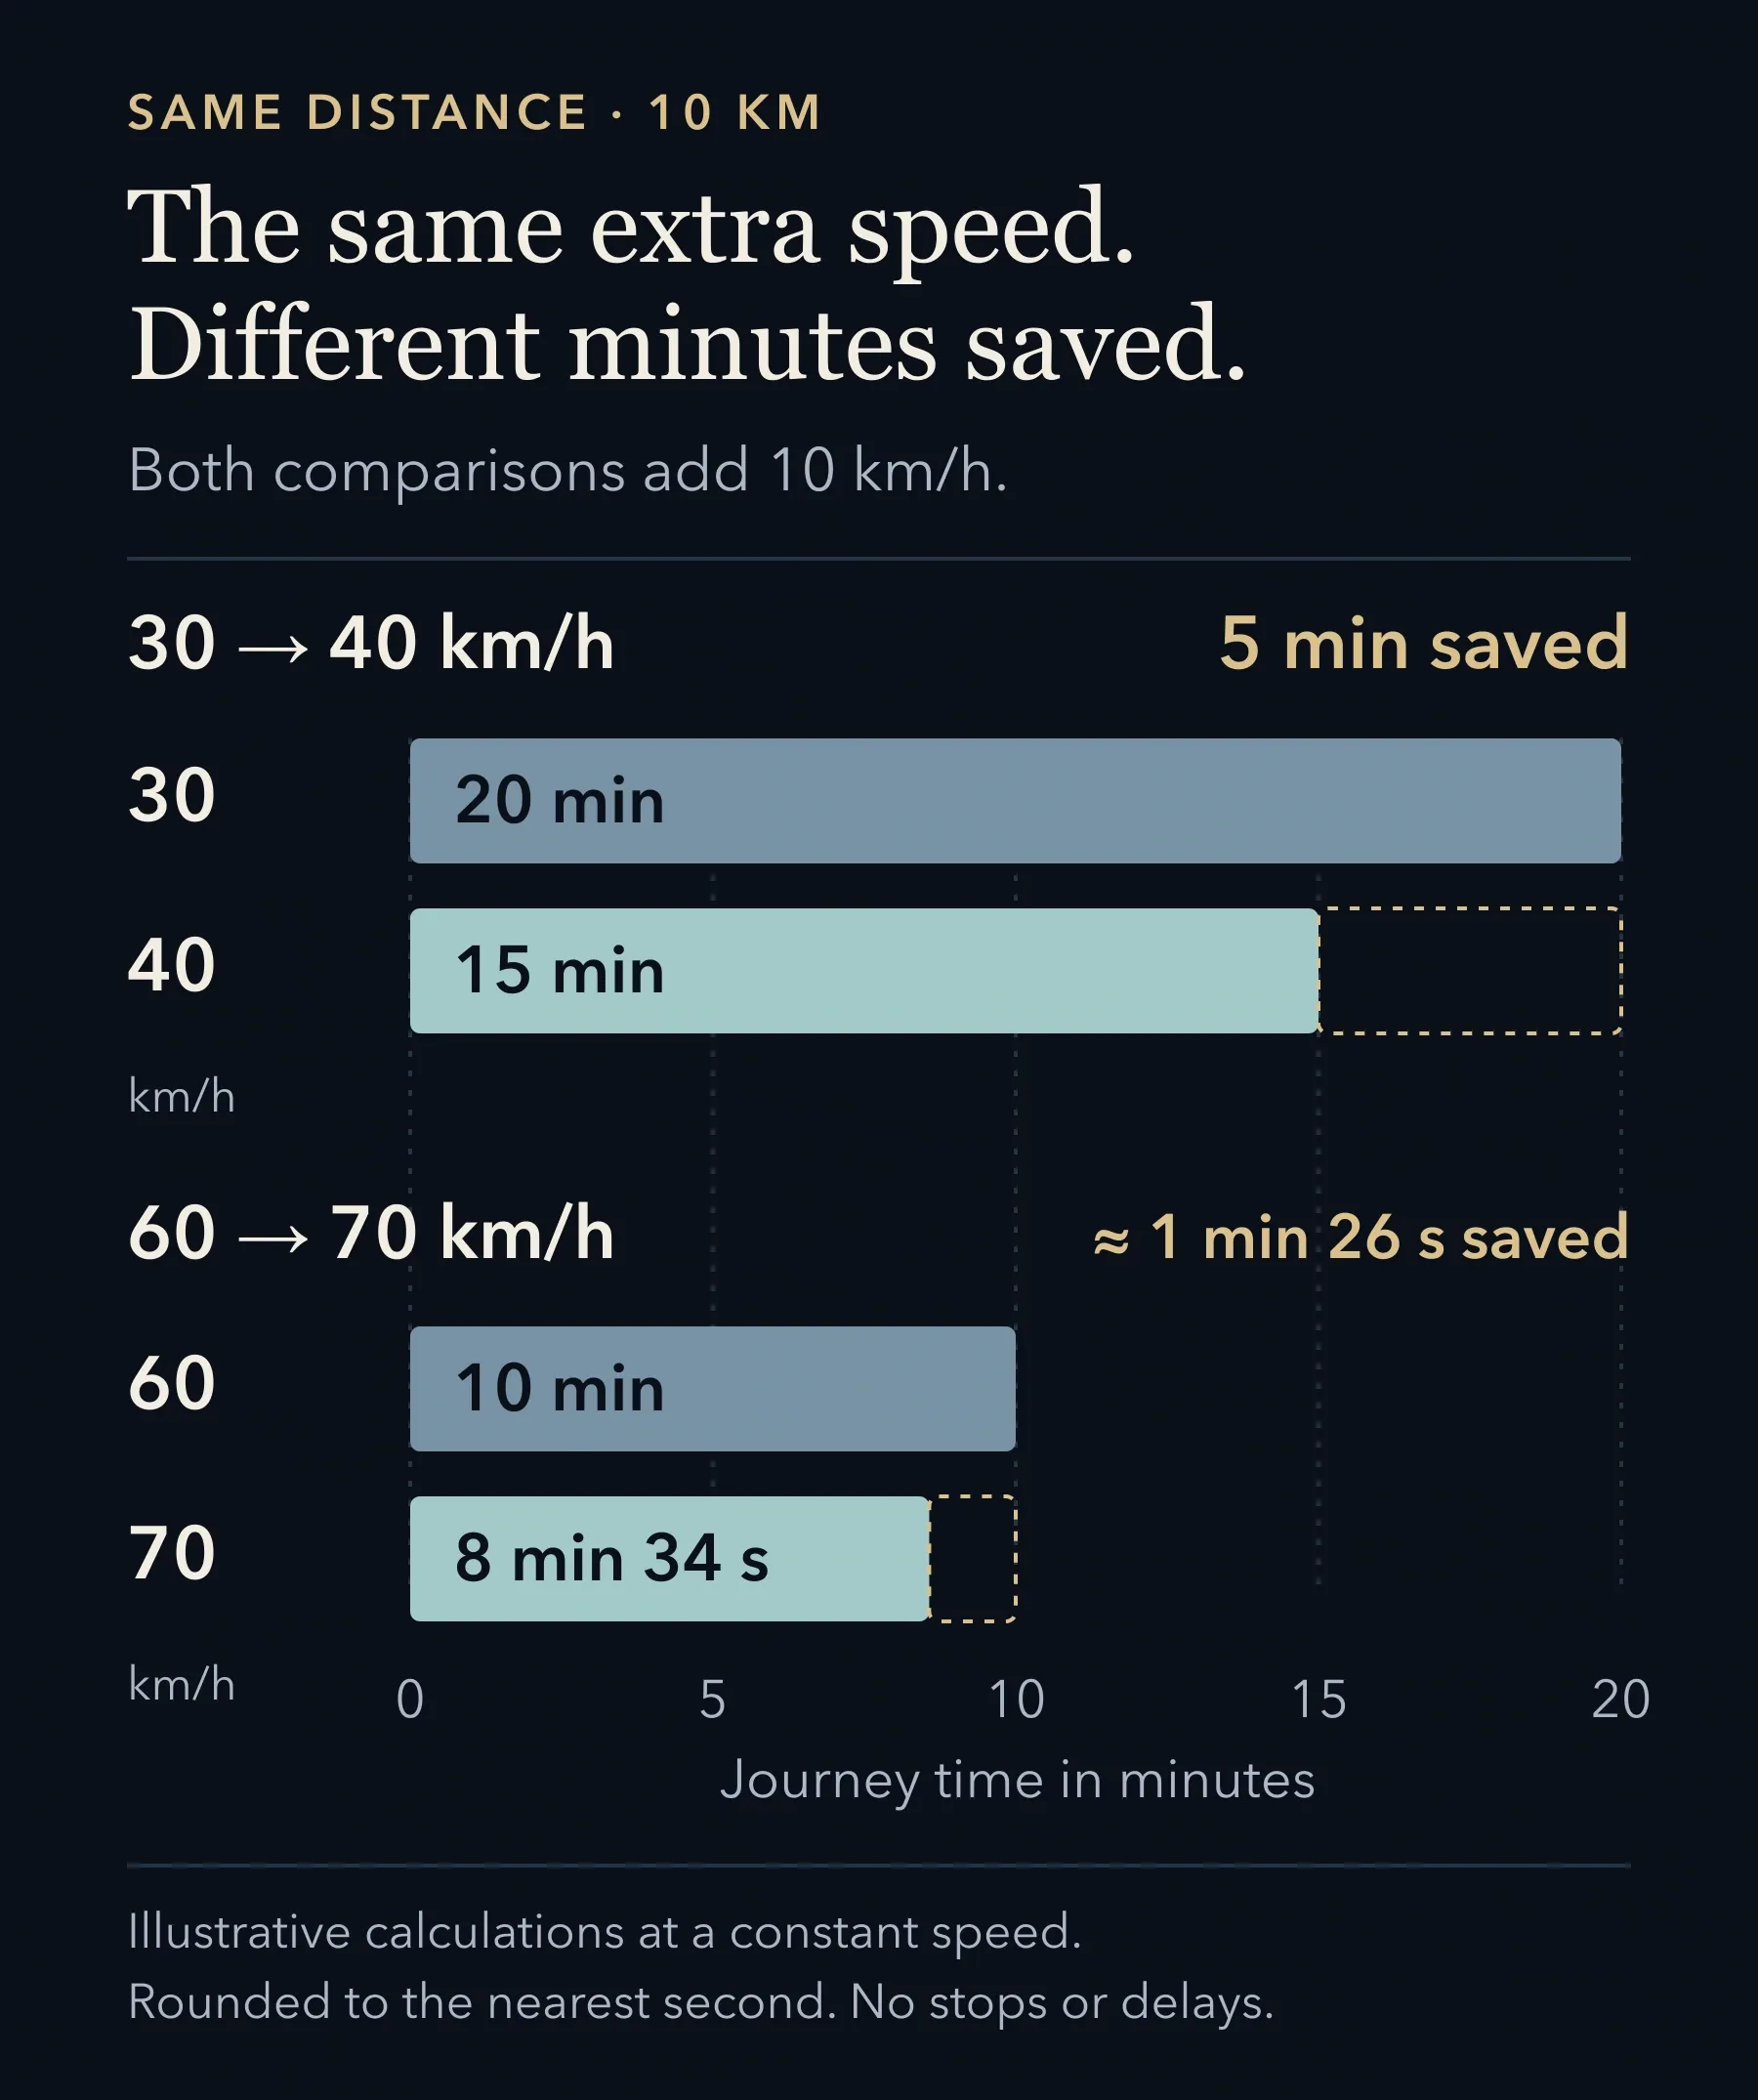
On paper we can set a distance and keep the speed constant. A 10km journey at 30kph takes 20 minutes. At 40kph it takes 15 minutes (a 5 minute saving). At 60kph it takes 10 minutes, at 70kph it takes about 8 minutes 34 seconds. So the same increase in speed (10kph) saves only about a minute and 26 seconds on the second journey as the second journey was only 10 minutes to start with.
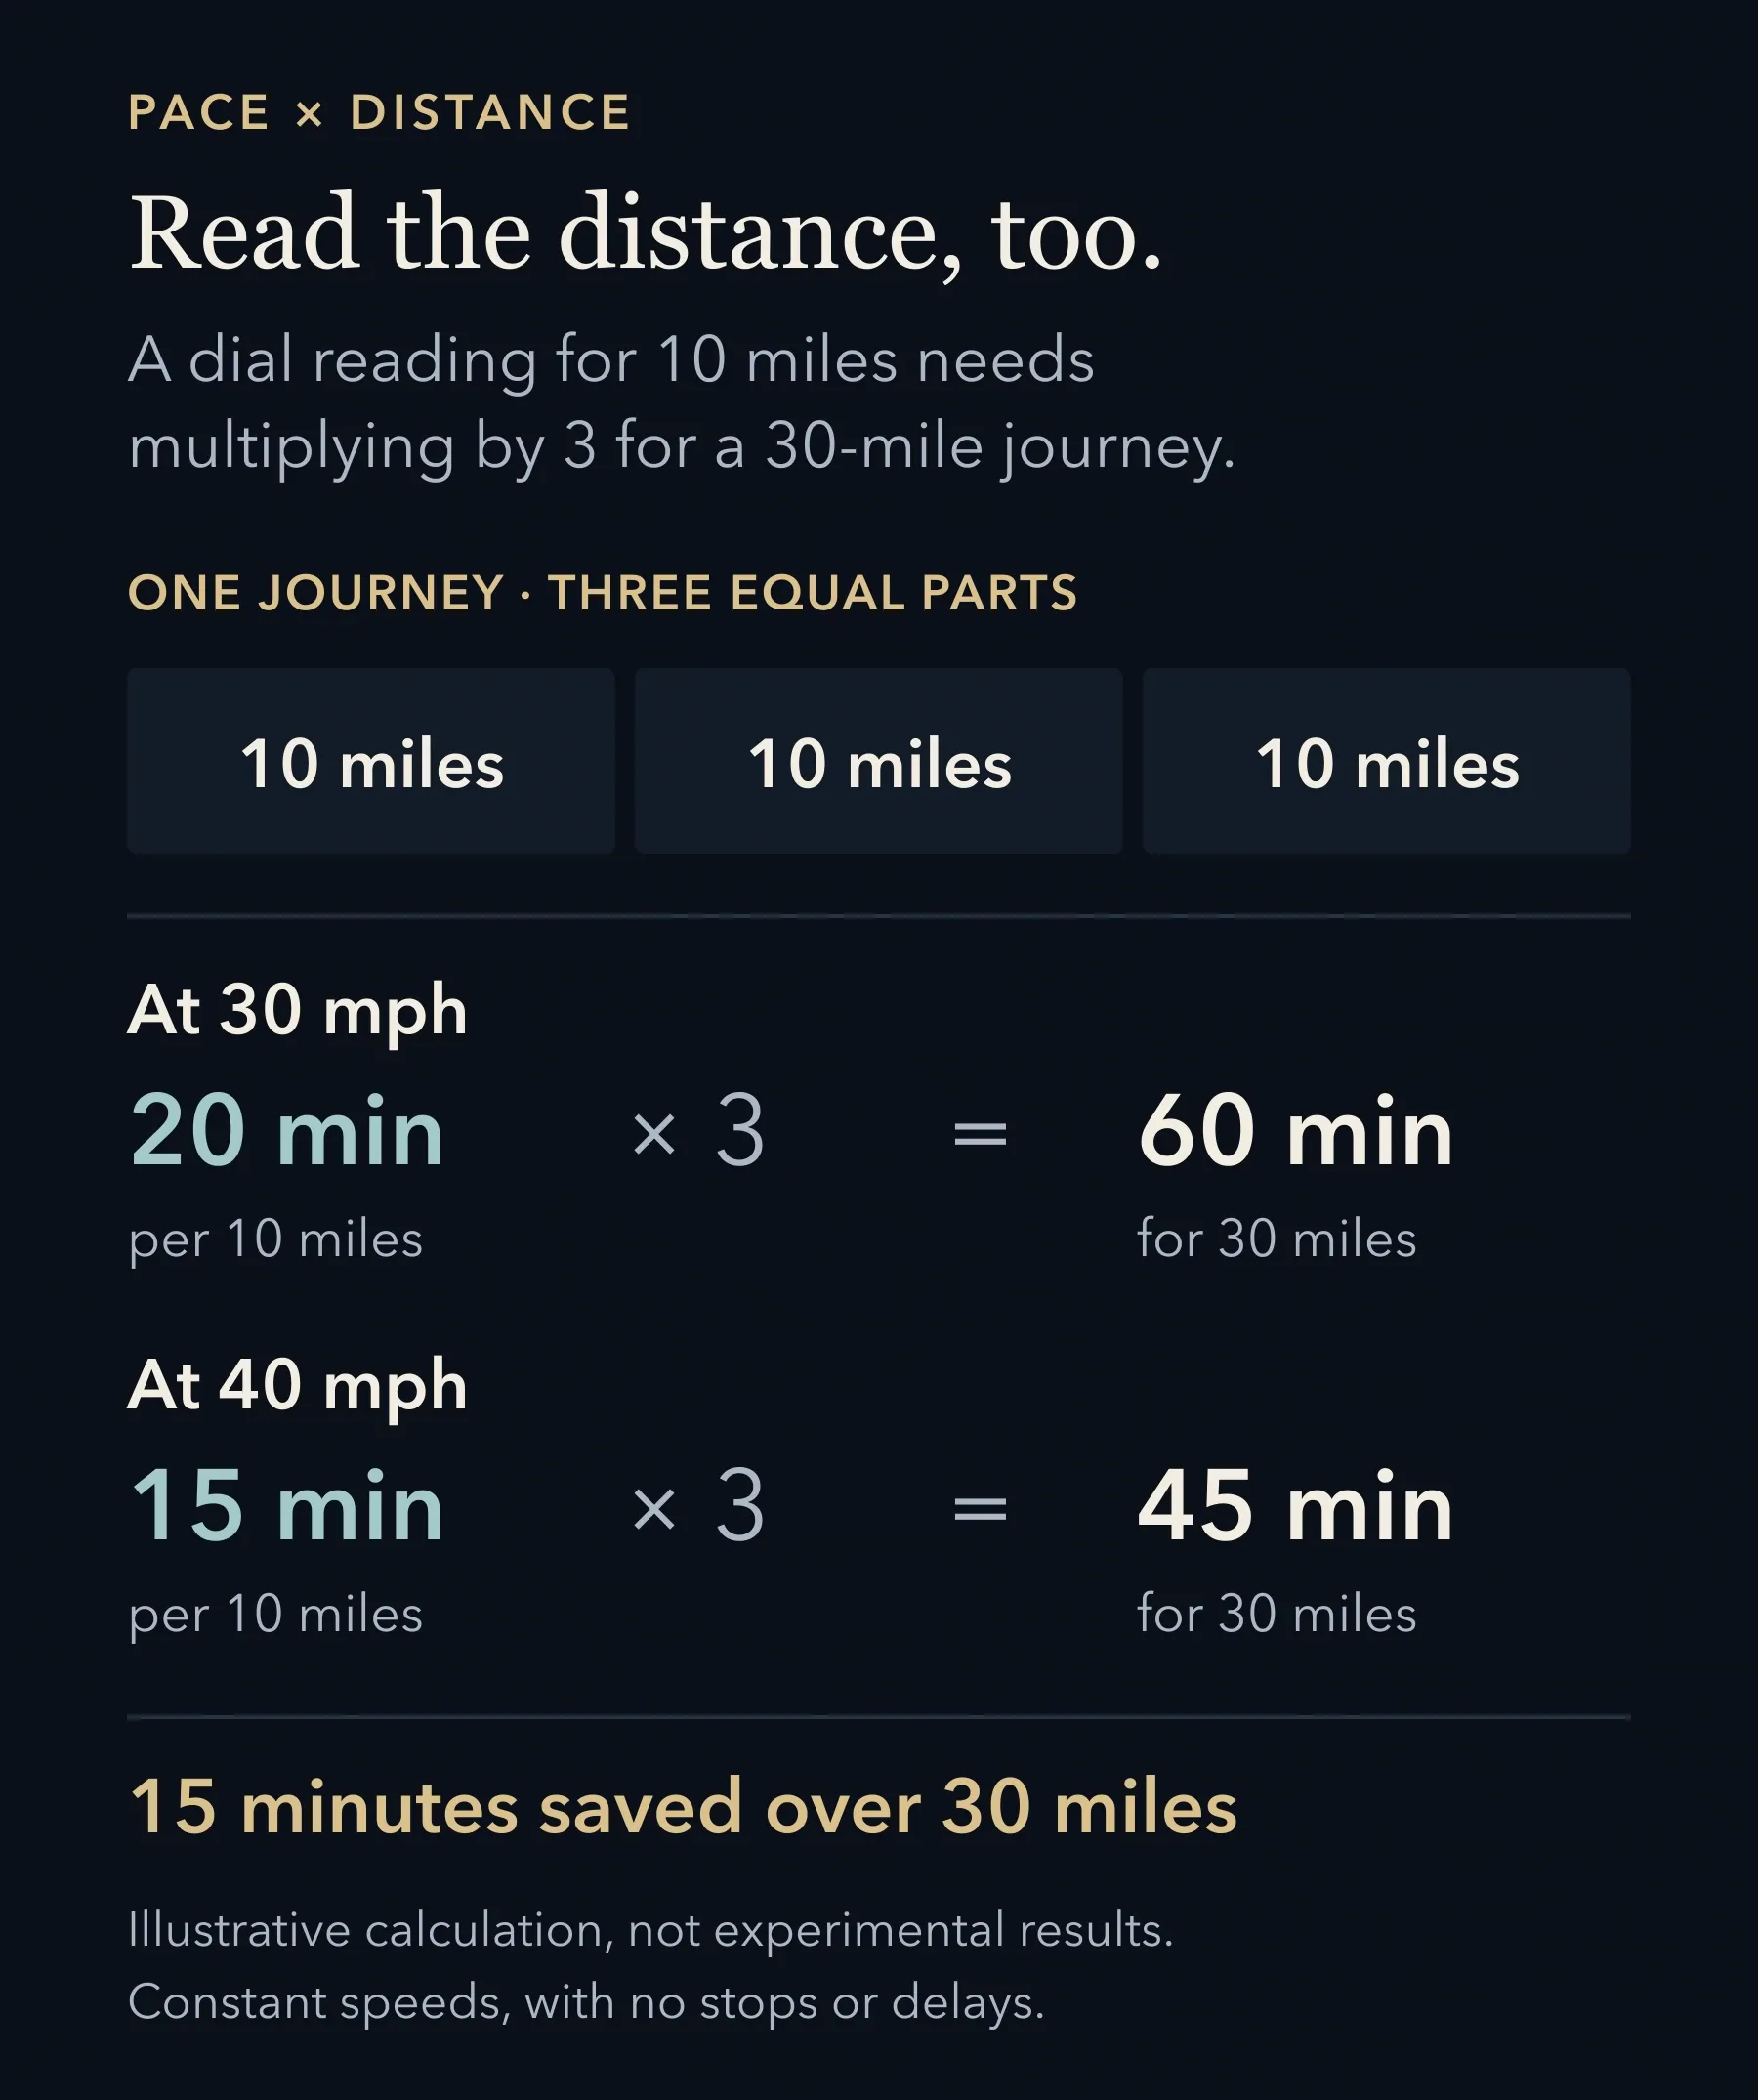
A normal speedo will tell you how far the car would go in an hour at its current speed. If you look at it the other way round you can see the minutes. At 30kph each km takes 2 minutes. At 40kph it takes 1.5 minutes. You can take the 30 seconds saved per km and multiply that by the distance. The time taken for a given distance is known as your pace. Of course that only works if you're maintaining a constant speed and you're not going to be taking any delays into account on the road ahead.
The simulator's faster journey revealed another issue for the drivers. The group using the standard speedometer had actually saved just over two minutes on average when starting at 100kph, but their estimates of the saving averaged over three. That's the time-saving bias (psychologists' term) in action. The amount of time saved by increasing speed from a low starting point is greater than people expect, whereas the time saved by increasing from a high starting point is less. At the assigned speeds, both original journeys would take around 17 minutes so the proportion of time they were asked to save was essentially the same in both cases. To save that amount of time, the person starting at 100 would have to increase their speed by a lot more than the person starting at 30.
This conversion could be done in advance and printed next to the usual numbers. In separate questionnaire studies, psychologists Eyal Peer and Eyal Gamliel kept the regular miles-per-hour markings on a dial. They added a ring of blue numbers showing minutes per ten miles. Participants had this image next to the questions and could refer to it as they answered. In the first study, when asked about savings from a low starting speed, the share of correct answers went up from about 24 percent with regular speed information to 43 percent with the pace numbers.
A thirty-mile problem required participants to do some extra math. The dial showed times for ten miles, and nine people in the pace group seemed to use those times without multiplying by three. Their answers were still included in the analysis, and for this task, the display offered little overall benefit.
For the simulator drivers using the pace display, who did not have a given journey length to multiply by, the dial reading changed as they drove. Their instrument showed minutes per kilometer instead of regular speed, and the pointer moved right to smaller numbers as the car sped up, making smaller movements at higher speeds. Drivers could read the numbers, watch how the needle reacted to the accelerator, or do both. Eriksson explains in her thesis that the researchers could not separate those contributions because both the units and the pointer's movement changed at the same time.
After the slow journey, the pace group saved about four minutes and 25 seconds on average, though this was with the instrument still in use and the tests didn’t establish if drivers would keep any improvement once it was taken away. They chose a slightly lower speed than the conventional group, so their result was closer to the assigned three minutes, though still above it.
The faster route was 28.3 kilometers long. If the original trip were done at exactly 100 kilometers an hour, saving three minutes would mean driving at about 121.5 kilometers an hour. We can figure this out because we know the distance. In the simulator, where drivers had to decide for themselves, the conventional group averaged about 114, which was not enough for the requested saving. The pace group chose almost 124. The instruction still asked for three minutes, even though more speed yielded smaller returns, and with pace information, the group increased speed more. Their average saving was three minutes and 28 seconds.
Sources and calculations
- Gabriella Eriksson, Ola Svenson, Lars Eriksson (2013). The time-saving bias: Judgements, cognition and perception. Judgment and Decision Making, 8(4), 492–497.
- Gabriella Eriksson, Ola Svenson, Lars Eriksson (2014). Debiasing time saving judgements by manipulation of speed display. Proceedings of the Human Factors and Ergonomics Society Europe Chapter 2013 Annual Conference, 161–168.
- Calculation note. The numerical examples assume constant speed and no delays. Journey time in minutes equals 60 × distance in kilometres ÷ speed in kilometres per hour. Time saved is the difference between the two journey times. For 28.3 km at exactly 100 km/h, the initial journey takes 16.98 minutes. Reducing it to 13.98 minutes requires approximately 121.46 km/h. These are calculations, not an additional experiment.
- Eyal Peer, Eyal Gamliel (2013). Pace yourself: Improving time-saving judgments when increasing activity speed. Judgment and Decision Making, 8(2), 106–115.
- Gabriella Eriksson (2014). On Physical Relations in Driving: Judgements, Cognition and Perception. Stockholm University, Department of Psychology.